IronLinks

Industrial Monitoring, Simplified

An on-premise IoT platform that connects your factory floor to a real-time web dashboard. No cloud subscription required. Your data stays on your network, on your server.

IronLinks Dashboard

What It Does

IronLinks bridges the gap between legacy industrial equipment and modern monitoring.

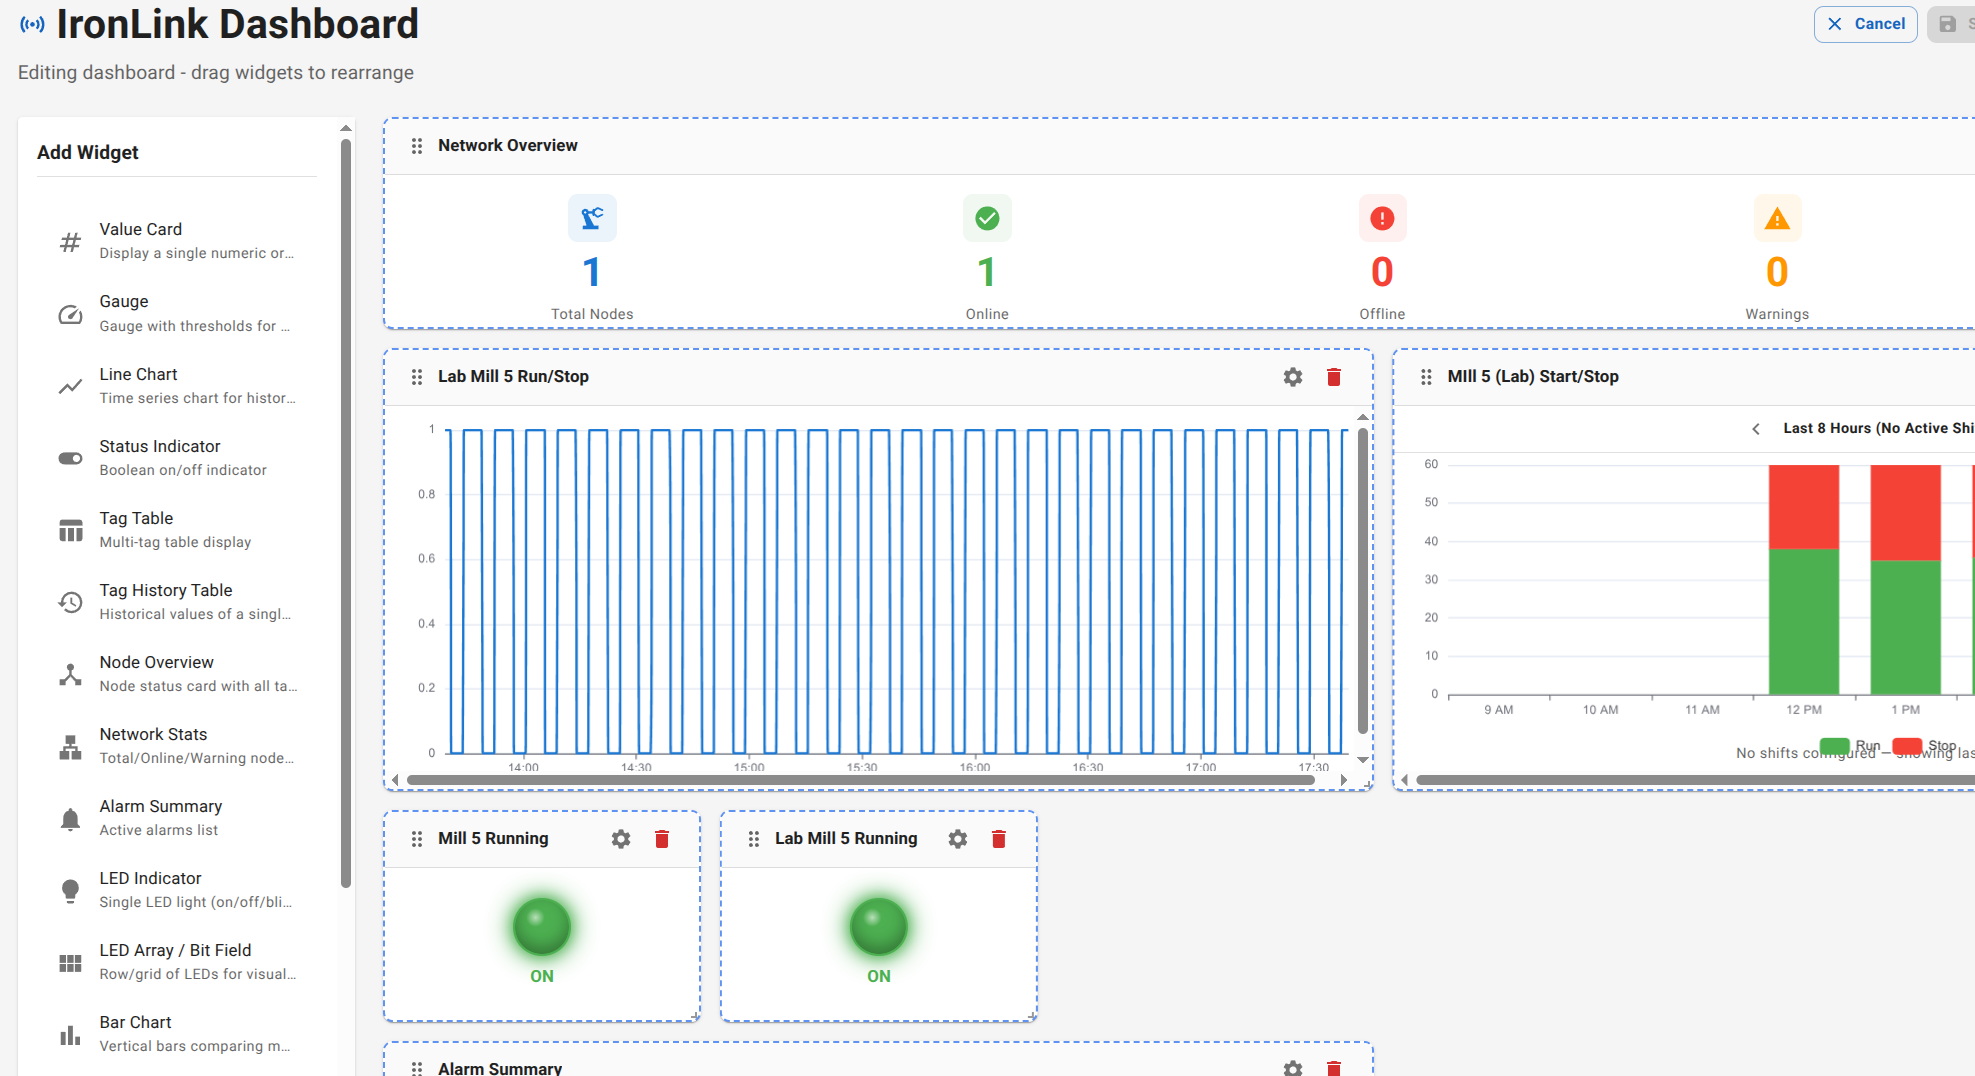
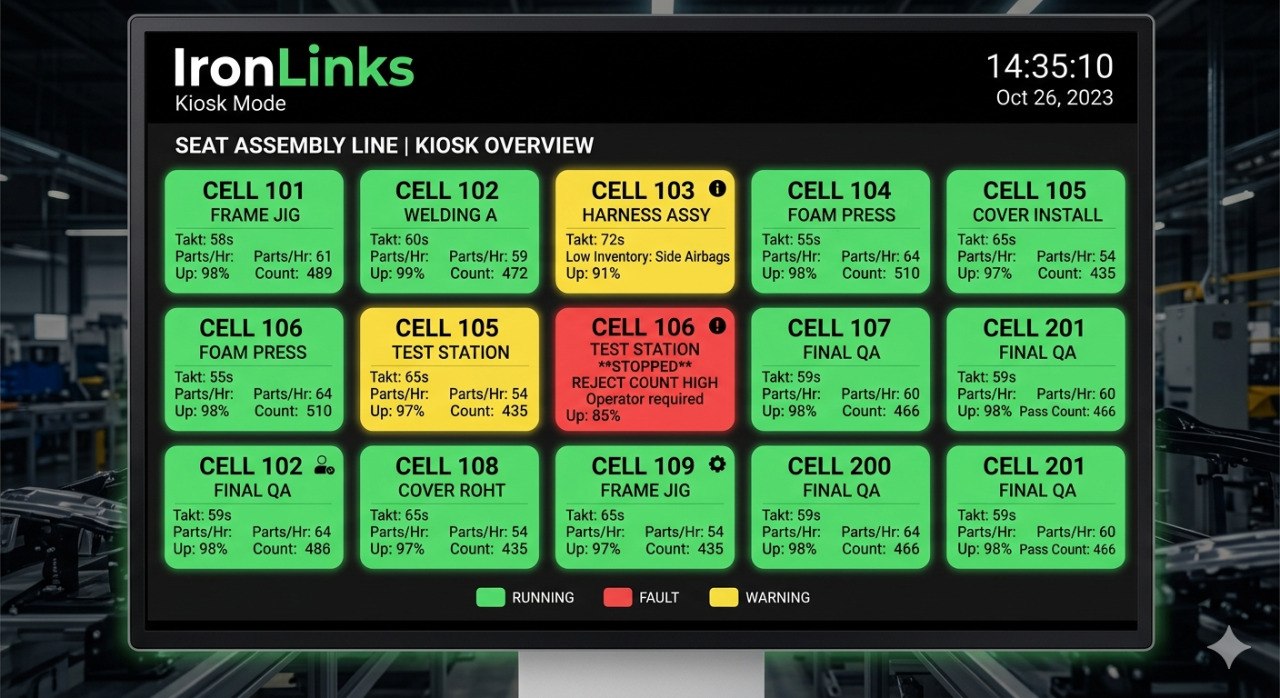
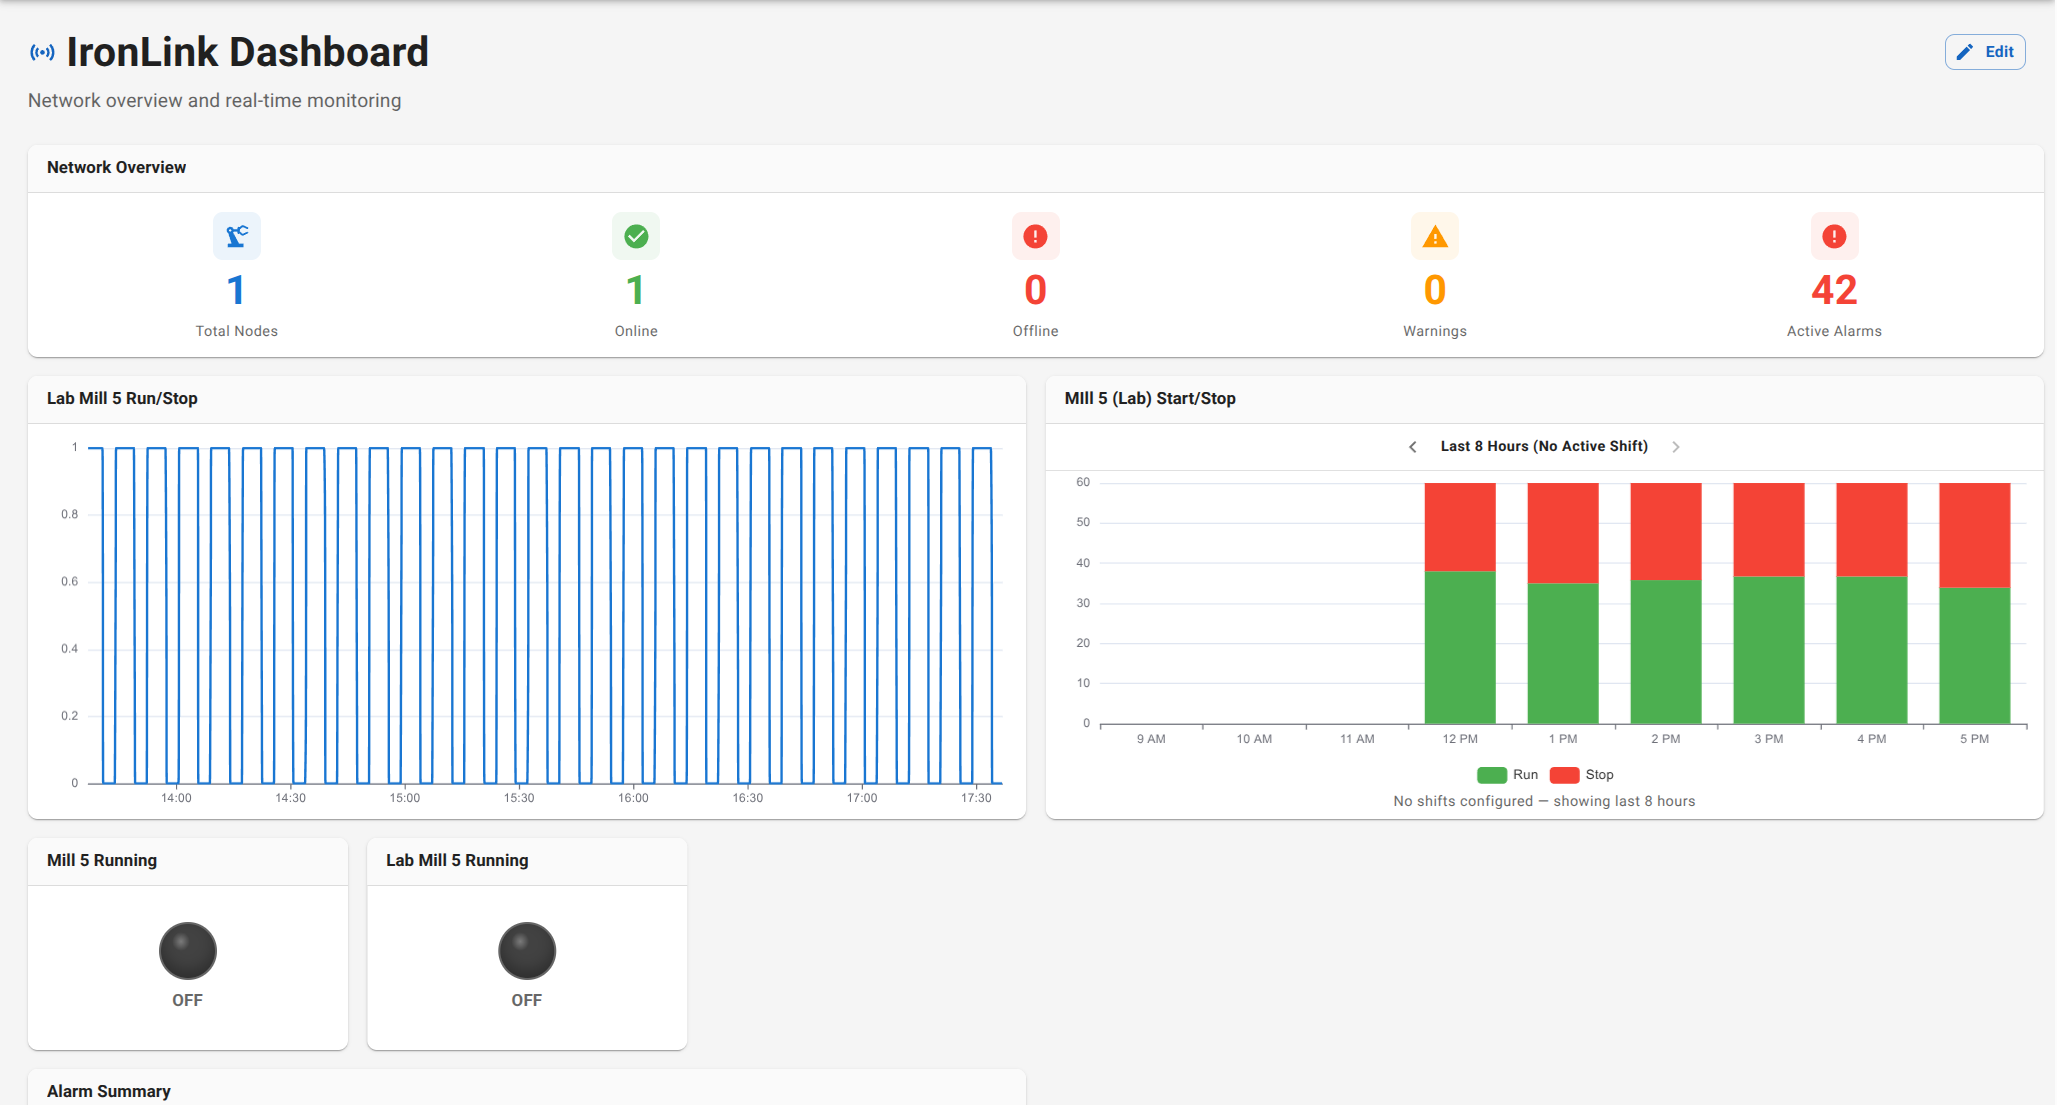
Small edge devices called IronNodes connect directly to your PLCs, stream live data over your local network, and feed it into a browser-based dashboard your team can use from anywhere on-site.

No proprietary hardware. No cloud dependency. Perpetual licenses.
Buy it once, run it forever. Your data stays on your network, on your server.

Key Features

Real-Time Machine Monitoring

See live production data, machine status, and PLC values updated every few seconds. Customizable per-node dashboards with 15+ widget types — gauges, charts, status indicators, tank levels, production counters, and more.

Plant-Wide Visibility

View all connected machines at a glance through our customizable Dashboard. Color-coded online/offline status, searchable machine lists, and logical grouping let you monitor an entire facility from a single screen.

Plug-and-Play PLC Connectivity

IronNodes support Allen-Bradley Ethernet/IP (ControlLogix, CompactLogix) and DF1 Serial (SLC 500, MicroLogix) out of the box, with Modbus TCP, Omron FINS Ethernet, and more on the roadmap. A built-in tag browser discovers PLC tags automatically — no manual address entry required.

Alarm Management

Define alarms against any PLC value or status bit. Active alarms surface immediately with severity levels (info, warning, critical), acknowledgment tracking, and full historical search. Export alarm history to CSV for compliance or analysis.

Custom Python Reporting

Build custom reports with a browser-based Python editor — no IDE required. Full standard library access (NumPy, Pandas, Matplotlib coming soon), syntax highlighting, live validation, test run, instant PDF/CSV export. Pre-injected variables for shifts, date ranges, and report modes mean you write logic, not boilerplate. Example: 50 lines of Python creates a shift-aware production report with stacked bar charts.

Calculated Tags

Create virtual tags using math expressions over real PLC values — no PLC programming changes needed. Calculated tags appear alongside real data in dashboards and reports.

Remote Configuration

Push tag mappings, polling intervals, and driver settings to IronNodes over the network. No SSH, no truck rolls. Configuration is versioned so you can review past deployments.

Smartphone Provisioning

New IronNodes can be set up with a mobile app — scan the QR code on the device label, configure WiFi over Bluetooth, and the node registers itself automatically. Target: under 3 minutes from power-on to data flowing.

Built for the Plant Floor

100% On-Premise

Everything runs on a single server at your facility — web app, database, MQTT broker. No internet connection required after initial setup. Deploy via USB to air-gapped environments.

Secure by Design

Every IronNode gets unique MQTT credentials with per-device access controls. JWT authentication on the web app. Sandboxed script execution. Encrypted BLE provisioning with forward secrecy.

Time-Series Storage That Scales

Powered by TimescaleDB with automatic compression, configurable retention policies, and pre-computed rollups. Store years of production data without slowing down queries.

Shift-Aware

Define your shift schedules and filter all reports and analytics by shift. IronLinks understands your operating hours so your data reflects how your plant actually runs.

No Vendor Lock-In

Low-cost, off-the-shelf hardware, standard protocols (MQTT, PostgreSQL), standard formats (CSV, PDF). Your data is always accessible and exportable.

Why IronLinks Wins

We've built what the big vendors won't — an open, affordable, vendor-neutral monitoring platform that works with your existing equipment.

Alarm Historian

vs. Rockwell FactoryTalk Alarm Historian
Rockwell/Allen-Bradley
  • ❌ Only works with Allen-Bradley PLCs (ControlLogix, CompactLogix)
  • ❌ Requires separate server installation and SQL Server license
  • ❌ Complex configuration in Studio 5000
  • ❌ Expensive licensing per client access

Database + Reporting

vs. Omron Sysmac / NX Series
Omron PLCs
  • ❌ Can write to database but NO built-in dashboard or reporting
  • ❌ Limited to MS SQL Server or MySQL only
  • ❌ Requires custom application development for visualization
  • ❌ No shift-aware analytics or pre-built templates

Complete Platform

vs. Kepware + Custom HMI
Kepware KEPServerEX
  • ❌ Connectivity only — zero visualization or dashboards
  • ❌ Writes tags to database but NO reporting system
  • ❌ Requires separate HMI/SCADA purchase ($5K-25K)
  • ❌ Annual sustaining support (~20%) effectively mandatory
The Bottom Line: IronLinks gives you a complete monitoring solution for less than the cost of individual components from other vendors.
No vendor lock-in. No à la carte module shopping. No "gotcha" annual fees.

How It Works

1

Install

Install an IronNode next to your PLC — connect via Ethernet or serial

2

Provision

Provision it with the mobile app or through the admin dashboard

3

Configure

Browse PLC tags from the UI or import from your PLC software

4

Monitor

Live data flows to your dashboard within seconds

Build Reports Your Way

Every factory tracks different things — daily quality summaries, weekly OEE by shift, compliance reports in specific formats. IronLinks lets your admin build exactly the report you need. No developer required, no software update, no waiting. Operators see a simple form: pick date range, select shift and machines, click Generate. The report renders instantly — export to PDF for email or CSV for Excel.

Python Report Editor

Browser-Based Editor

Built-in code editor with Python syntax highlighting and real-time validation. Your admin writes the logic once — operators just pick date range, shift, and machines from a simple form. No developer required, no software updates, no waiting.

Shift-Aware by Default

IronLinks knows your shift schedules. Scripts automatically filter by shift time without manual date math. Pre-injected variables like `shift_names` and `report_mode` handle the complexity — you write business logic, not boilerplate.

Rich Visualizations

Build KPI cards with trend indicators, data tables, or charts — line, bar, stacked bar, pie, scatter, area, histograms. Combine multiple visualizations in one report. Export to PDF for email/printing or CSV for Excel analysis.

Safe & Versioned

Scripts run in a locked-down sandbox: read-only SQL access, no filesystem or network, 30-second timeout. Every edit creates a new version with full history — see who ran what, when, and how long it took.

Flexible Inputs

Add custom parameters to your scripts — dropdowns, numbers, dates, toggles. One report script can serve multiple use cases. Start from included templates (production summaries, alarm histories, shift comparisons) and customize.

Any Data Source

Query any tag data, alarm history, or machine metrics across any time range. Filter by machine, machine group, or production line. Aggregate by hour, day, week, or month depending on report mode.

The Result: Complex custom reports in minutes, not days. The example above shows ~50 lines of Python generating a shift-filtered boolean state report with stacked bar charts — exported to PDF with one click.
No vendor lock-in. If you can write Python, you can build any report you need.

See It In Action

Who It's For

Small to Mid-Size Manufacturers

Need production visibility without enterprise-scale cost

Legacy PLC Facilities

SLC 500, MicroLogix systems lacking built-in connectivity

Secure Plants

Require on-premise data due to security policy, air-gap requirements, or unreliable internet

Operations Teams

Want alarm tracking, shift-based reporting, and machine status without a custom SCADA build

See IronLinks in Action

We'll show you how it works with your existing PLCs.

Request a Demo